Quickstart guide
Record your first replay with the Replay browser in under a minute.
Recording your application with the Replay browser lets you capture a bug once and inspect it after the fact without having to reproduce it again. This makes it possible to:
- Share the replay as a URL with your team so others can inspect it as if they were there when you recorded it.
- Debug the replay with
console.logadded in at any point of the recording. - Inspect Network requests, React components, and DOM elements as if the application were running live on your laptop.
The ability to record and deterministically replay runtimes like Chrome is referred to as "time travel".
Let's use the Replay CLI to record our first replay so you too can start time traveling:
Install the Replay CLI
Run the following command to download and install the Replay CLI:
Terminal
Start recording
Run the following command to open the Replay browser and start recording.
Terminal
This command will:
- Prompt you to login to your Replay account (if not already logged in)
- Install the Replay browser (if not already installed)
- Open the Replay browser for you to record an interaction to dive deeper into
Upload your replays
When you close the browser, you'll be prompted to upload your recordings.
Terminal
View your replay
Once the upload is completed, the CLI will give you the replay url.
Terminal
This URL is a real recording. Press the link to inspect the site!
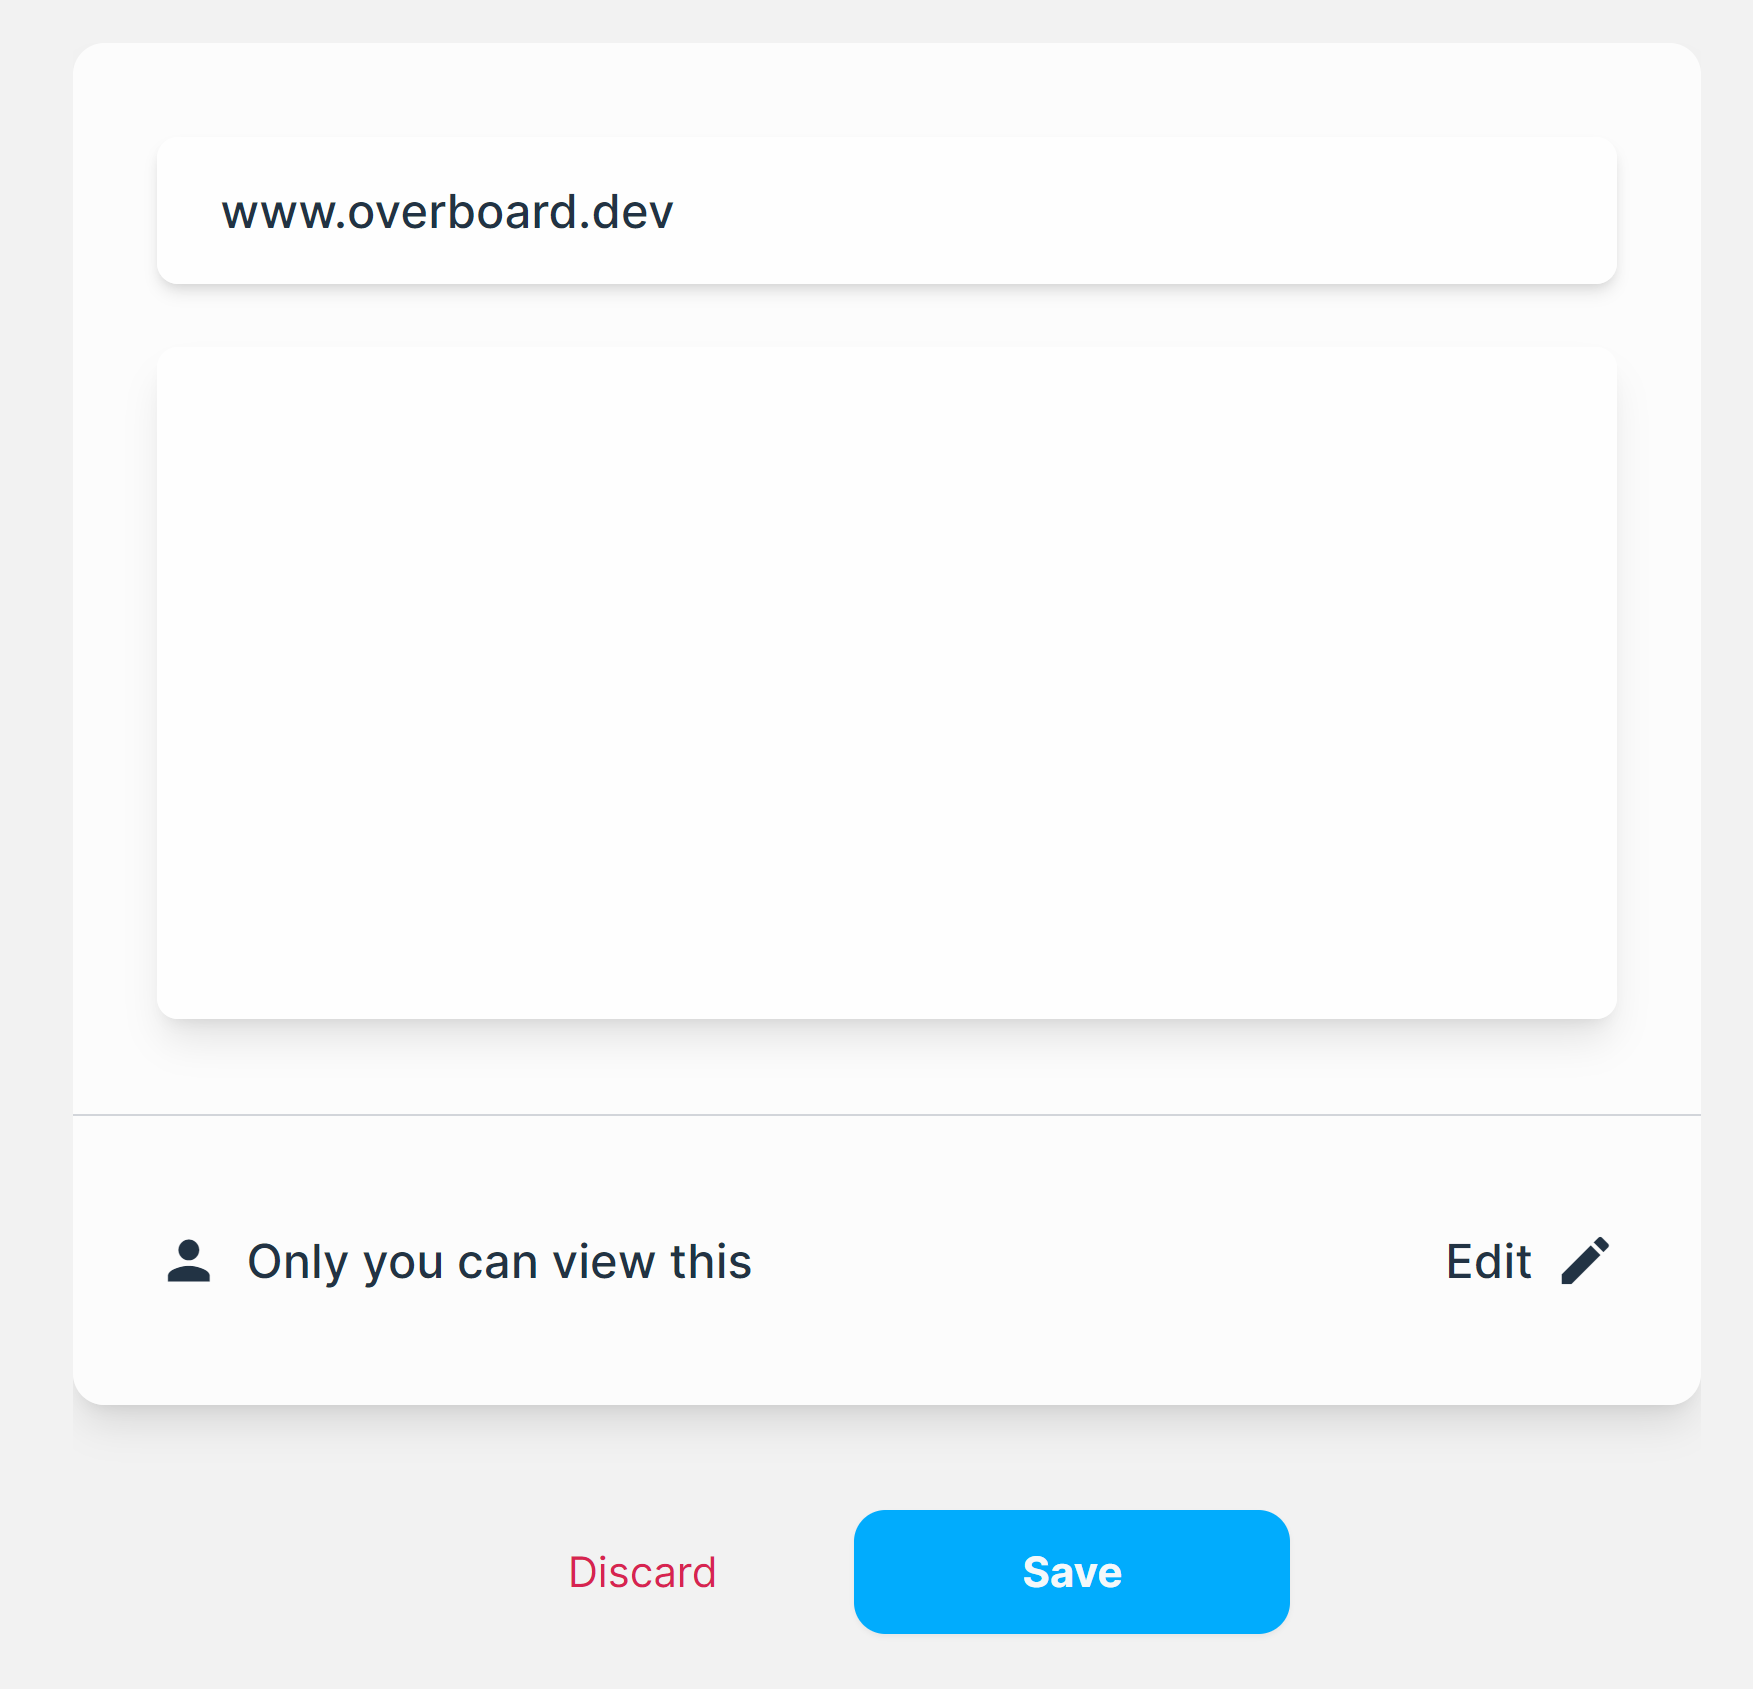
When you open the "View recording" link in a browser, you'll be greeted with a dialog asking if you want to upload the recording to a specific team.

If you don't have a team yet, you can create a team in the Replay Library.
Inspect your replay
Once your recording is uploaded, you're able to inspect it through the Replay DevTools.

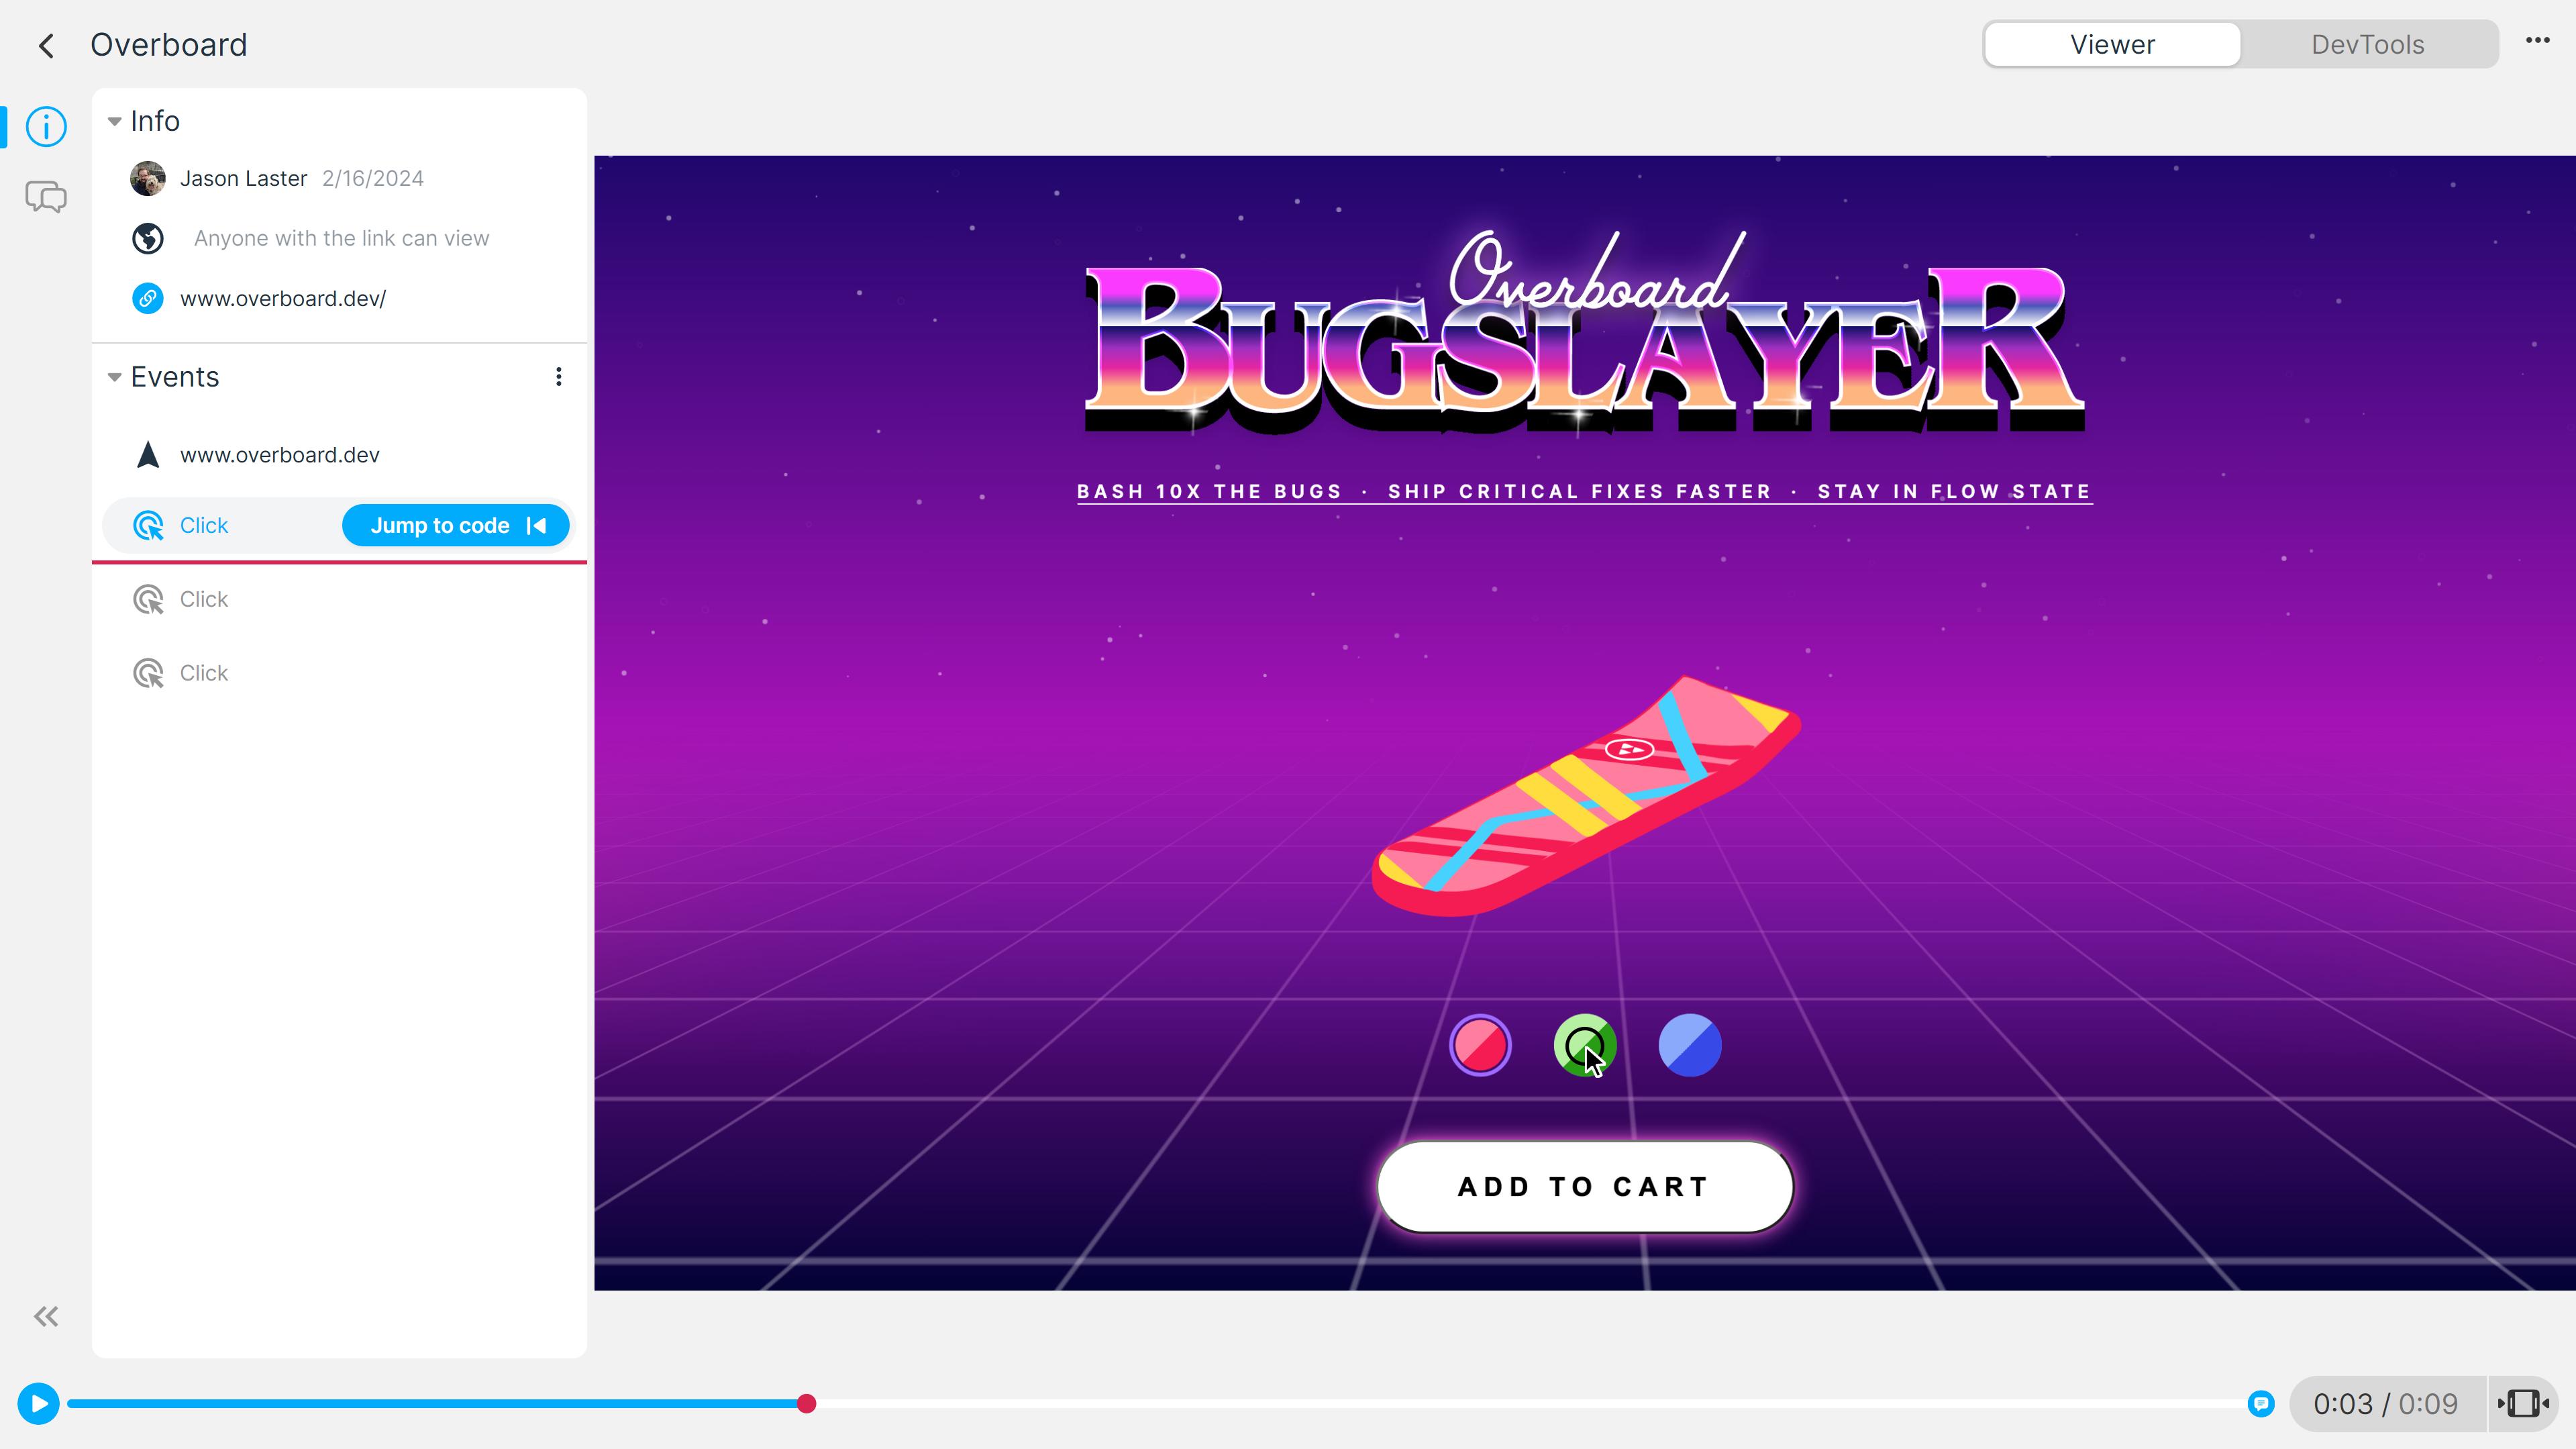
By default, you're set to "Viewer" mode. You can change the view to "DevTools" mode either by pressing the toggle in the top-right corner or by selecting an "Event" and pressing "Jump to code"
Let's jump to the last "Click" before the recording hit an error and see the code related to it:
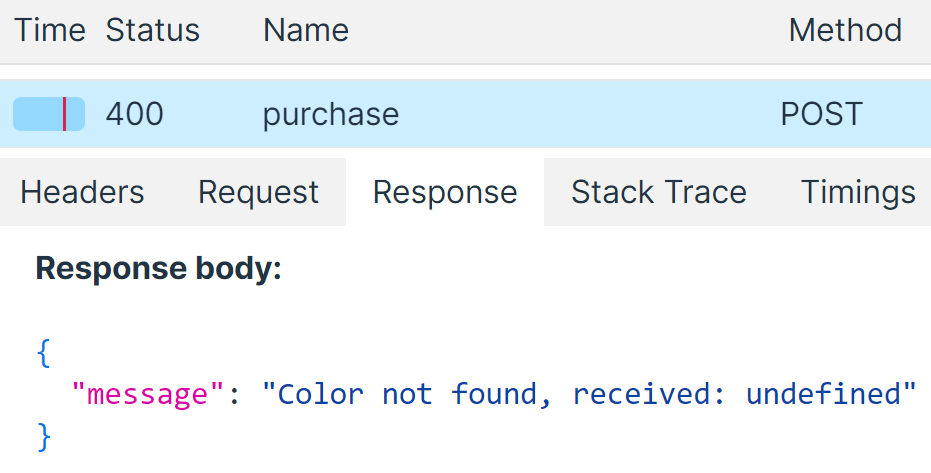
It looks like we're making a "POST" to an endpoint of "/api/purchase". Let's open our network panel and see what the request looks like:

Selecting the 400 error in the network panel allows us to look at the request and reply. Here, the request is indicating that "Color is not found, recieved: undefined" was the response from our backend:

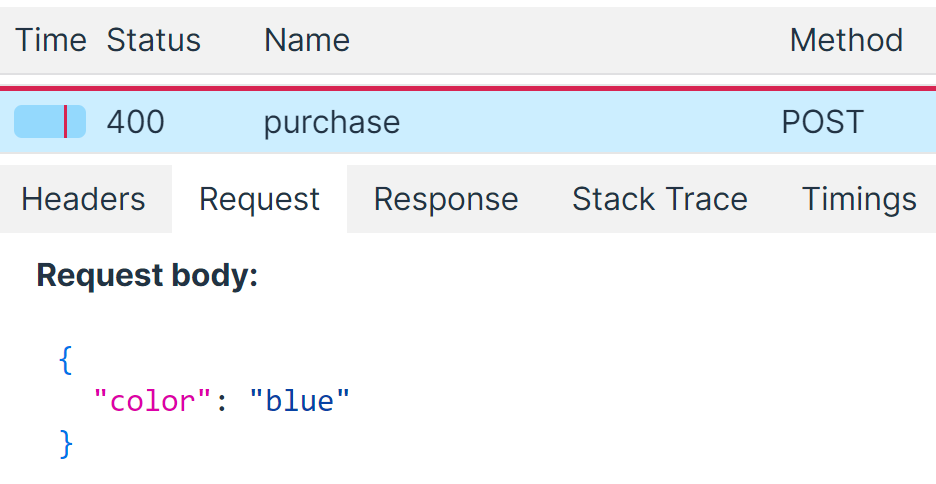
But looking at the request body, it looks like we're sending the color along just fine:
 With this information, we can go to our backend team more informed with how to report a ticket to solve this.
We can even integrate Replay into our CI/CD pipeline to help debug flakey tests much more efficiently.
FAQ
Manage your recordings
Learn how to upload, remove and view your recordings using CLI
Replay DevTools
Learn how to use Replay DevTools to debug your tests.
Setting up a team
Learn how to create a team in the Replay App
Test Suites
Stay on top of your test suite's health with Replay for Test Suites.